
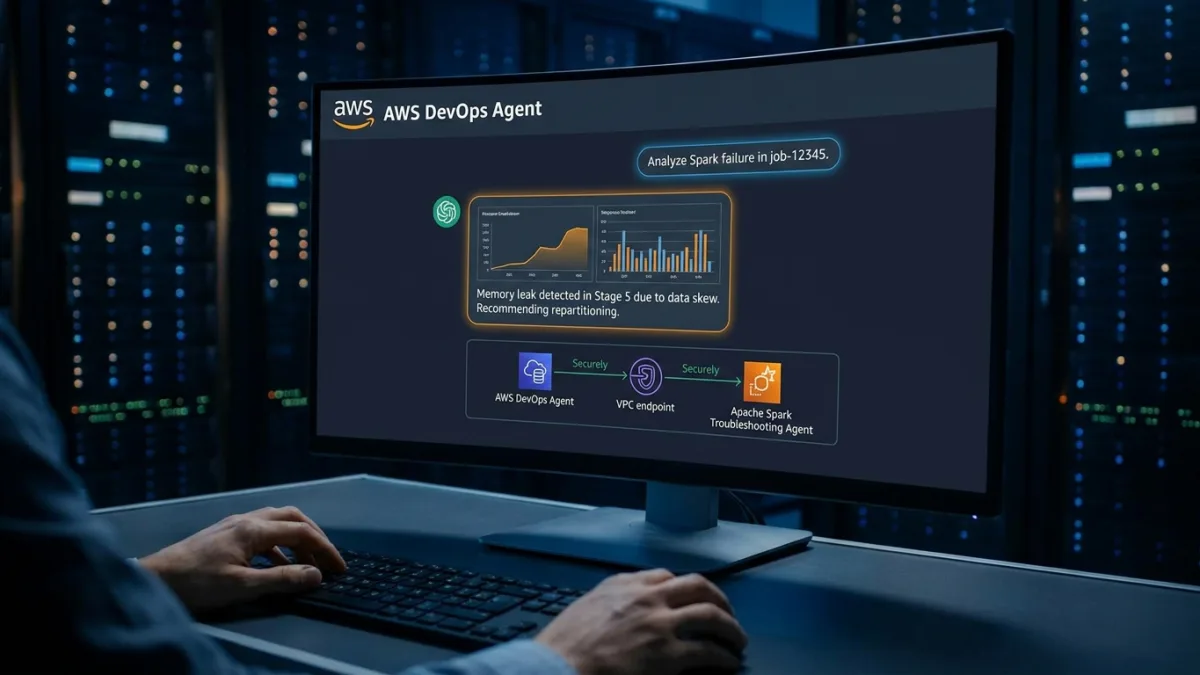
Debugging Apache Spark failures on Amazon EMR often means spending hours digging through executor logs, memory profiles, and complex application code. As data pipelines grow, correlating these metrics across multiple services requires significant operational effort. The AWS DevOps Agent now automates this tedious process by integrating with the Apache Spark Troubleshooting Agent, allowing you to pinpoint memory leaks and code errors in minutes using a single chat prompt.
Traditionally, native AWS API tools could not extend into Spark-internal artifacts. They could describe symptoms, such as an executor exiting with code 1, but failed to identify the actual antipattern causing the crash. By leveraging the Model Context Protocol (MCP), operators can now bridge this gap without exposing sensitive diagnostic data to the public internet.
Understanding the Model Context Protocol (MCP) Integration
The Model Context Protocol (MCP) is an open standard that defines how AI agents discover and invoke external tools. AWS DevOps Agent supports connecting to custom MCP servers, enabling you to expose new capabilities without modifying the core agent itself. When connected, the agent automatically discovers available tools, understands their schemas, and calls them during its investigation workflow.
For this specific integration, you do not need to build an MCP server from scratch. The Apache Spark Troubleshooting Agent for Amazon EMR operates as a managed MCP server hosted by AWS at a regional endpoint. Your primary task is to register that endpoint with the AWS DevOps Agent and authorize it using an AWS Identity and Access Management (IAM) role for Signature Version 4 request signing.
This architecture ensures that traffic never traverses the public internet. Requests flow from the AWS DevOps Agent into your Amazon Virtual Private Cloud (Amazon VPC) via a private connection, routing through an Interface VPC Endpoint directly to the managed troubleshooting agent.
Why Spark Internals Visibility Matters
The actual root cause of a Spark failure usually resides in areas that standard APIs, like Amazon CloudWatch Logs Insights or AWS CloudTrail, cannot reach. The Apache Spark Troubleshooting Agent reads directly from critical internal sources to provide actionable insights.
First, it analyzes the Spark History Server event log, which is a per-job archive stored in Amazon Simple Storage Service (Amazon S3). This log contains stage timings, task-level metrics, executor utilization, and garbage-collection pauses. Interpreting signals like data skew or executor memory pressure requires deep familiarity with Spark internals, which the agent handles autonomously.
Additionally, the agent examines the Spark query plan and the application source code. Without the logical and physical plans, identifying unnecessary data repartitioning or missing broadcast hints is nearly impossible. Finally, it monitors Python worker process telemetry, catching memory exhaustion errors that standard Java Virtual Machine (JVM) logs often miss.
Prerequisites for the AWS DevOps Agent Setup
Before deploying the solution, ensure you have an active AWS account with permissions to deploy AWS CloudFormation stacks. These stacks will create the necessary IAM roles and Amazon VPC resources required for the private connection.
You must also have the latest version of the AWS Command Line Interface (AWS CLI), Boto3, and Botocore installed. Ensure these tools are configured with credentials for the same AWS account and Region where you plan to deploy the troubleshooting environment.
Step 1: Clone the Repository and Deploy CloudFormation
To begin, you need to clone the official AWS samples repository containing the CloudFormation template, the PySpark script, and the Parquet data used for this demonstration.
git clone https://github.com/aws-samples/sample-aws-data-processing-and-analytics.gitNext, deploy the CloudFormation stack using the AWS CLI. This stack provisions a dedicated Amazon VPC, an Interface VPC Endpoint, and a deliberately failing PySpark workload running on Amazon EMR Serverless.
cd sample-aws-data-processing-and-analytics/blogs/devops-agent-spark-mcp-integration

aws cloudformation create-stack \
  --stack-name spark-troubleshooting-demo \
  --template-body file://cloudformation/spark-troubleshooting-devops-agent-blog.yaml \
  --capabilities CAPABILITY_NAMED_IAM \
  --region us-east-1
The stack takes approximately 4 to 6 minutes to reach the CREATE_COMPLETE status. Once finished, retrieve the stack outputs, which include your VPC ID, subnet IDs, security group ID, and the MCP endpoint URL.
aws cloudformation describe-stacks \
  --region us-east-1 \
  --stack-name spark-troubleshooting-demo \
  --query "Stacks[0].Outputs" --output table
Finally, copy the demo script and Parquet data to the newly created Amazon S3 bucket using the following commands.
DEMO_BUCKET=$(aws cloudformation describe-stacks --stack-name spark-troubleshooting-demo --region us-east-1 --query 'Stacks[0].Outputs[?OutputKey==`DemoBucket`].OutputValue' --output text)

aws s3 cp scripts/customer_events_aggregator.py s3://$DEMO_BUCKET/customer_events_aggregator.py

aws s3 cp data/ s3://$DEMO_BUCKET/data/ --recursive
Step 2: Configure the Agent Space and Private Connection
The agent space defines which AWS account and Region the AWS DevOps Agent monitors, the IAM role it assumes, and the capability providers it can call. Create a new agent space in the AWS console using the following parameters:
- Name: data-pipeline-troubleshooting
- Region: us-east-1
- Agent Space role: Choose Auto-create a new DevOps Agent role.
Once the agent space reaches the Active status, you must create the AWS DevOps Agent private connection. This connection allows the agent to securely reach into your Amazon VPC.
- Name: spark-private
- VPC: Use the DemoVpcId from your stack outputs.
- Subnets: Use both subnet IDs from DemoSubnetIds.
- Security group: Use the SMUSVpcEndpointSecurityGroupId.
- TCP port ranges: 443
- Host address: sagemaker-unified-studio-mcp.us-east-1.api.aws
- DNS resolution: In VPC (private DNS)
Step 3: Register and Add the MCP Server
With the private connection active, register the MCP server as a capability provider in the AWS DevOps Agent console. Name the provider spark-troubleshooting, input the MCPEndpointURL from your stack outputs, and select the option to connect using a private connection.
Next, add the registered MCP server to your agent space workspace so the agent can utilize its tools during an investigation.
- Navigate to the MCP Server section in your agent space and choose Add.
- In the Add a capability dialog, locate
spark-troubleshootingand choose Add. - On the Select MCP server tools page, check the boxes for both
analyze_spark_workloadandanalyze_spark_history_server_endpoint, then choose Save.
The agent space will now display that both tools are connected and available in your agent's catalog, ready to diagnose Spark failures.
Step 4: Trigger a Failing Job and Investigate
To see the integration in action, submit the deliberately failing PySpark job. The script simulates a common memory bug where a user-defined function accumulates too many copies of an input row, causing the Python worker process to exceed its 256 MB memory cap.
aws emr-serverless start-job-run \
  --region us-east-1 \
  --application-id  \
  --execution-role-arn  \
  --name daily-customer-events-rollup \
  --job-driver '{"sparkSubmit":{"entryPoint":"s3:///customer_events_aggregator.py","entryPointArguments":[""],"sparkSubmitParameters":"--conf spark.executor.cores=2 --conf spark.executor.memory=1g --conf spark.executor.pyspark.memory=256m --conf spark.executor.instances=2"}}' \
  --configuration-overrides '{"monitoringConfiguration":{"s3MonitoringConfiguration":{"logUri":"s3:///logs/"}}}'
The job will transition to a FAILED state in about four minutes, triggering the Amazon CloudWatch alarm named FailedJobs. Once the alarm fires, open your AWS DevOps Agent space, navigate to Incidents, and start an investigation using the following prompt:
CloudWatch alarm in us-east-1 just went into ALARM state. Investigate why and recommend a fix
The agent will chain native AWS API tools to find the failed job run, and then invoke the analyze_spark_workload MCP tool. The resulting Root Cause tab will display the exact line of code causing the memory amplification, the inefficient repartitioning strategy, and concrete configuration fixes.
Step 5: Clean Up Resources
To avoid ongoing charges, you must delete the resources created during this tutorial. Start by removing the configurations within the AWS DevOps Agent console to prevent stack deletion failures.
- In the AWS DevOps Agent console, open your agent space, select the MCP Server section, and remove
spark-troubleshooting. - Delete the
data-pipeline-troubleshootingagent space entirely. - Deregister the
spark-troubleshootingcapability provider. - Delete the
smus-spark-privateprivate connection.
Finally, delete the AWS CloudFormation stack using the AWS CLI to remove the Amazon VPC, IAM roles, and Amazon S3 buckets.
aws cloudformation delete-stack \
  --region us-east-1 \
  --stack-name spark-troubleshooting-demo
The Shift Toward Semantic Root Cause Analysis
The integration of the Model Context Protocol (MCP) into the AWS DevOps Agent represents a fundamental shift in how data engineering teams handle incident response. For years, debugging distributed systems like Apache Spark relied heavily on log aggregation and keyword searching. Engineers had to manually piece together JVM crashes, Python worker telemetry, and CloudWatch metrics. By allowing AI agents to securely access internal artifacts like the Spark History Server and query plans, AWS is moving the industry from basic log retrieval to semantic root cause analysis.
What makes this implementation particularly powerful is its security posture. By routing MCP calls through AWS PrivateLink and Interface VPC Endpoints, AWS ensures that sensitive application code and proprietary data schemas never traverse the public internet. This removes the primary compliance hurdle that has historically prevented enterprise data teams from adopting AI-driven debugging tools. The agent doesn't just summarize an error code; it reads the actual Python script, identifies the exact line causing memory amplification, and suggests a targeted fix.
Looking ahead, this architecture sets a precedent for how cloud providers will handle complex workload diagnostics. As data pipelines become increasingly abstracted through serverless offerings like Amazon EMR Serverless, the underlying infrastructure becomes harder to inspect manually. Tools that can autonomously navigate these abstractions, correlate cross-service telemetry, and deliver line-numbered code fixes will transition from being optional productivity boosters to mandatory operational requirements for maintaining high-availability data platforms.
This article was written by AI from reporting by aws.amazon.com.