Atlassian's Jira Cloud platform, a cornerstone for enterprise project management, faces the monumental challenge of maintaining peak performance across thousands of tenants with diverse workloads. The engineering team has pioneered a multi-layered system to catch performance regressionsunintended slowdowns introduced by code changesthat affect only a small slice of users, preventing them from cascading into widespread outages. This is crucial for DevOps engineers, site reliability engineers (SREs), and software architects managing high-scale SaaS applications, as it solves the problem of elusive bugs hidden in production-like variability.
By integrating automated detection with proactive mitigation, Atlassian ensures Jira Cloud delivers consistent speed, even under extreme conditions like peak usage during global sprints or complex workflow customizations. For instance, a regression slowing query responses by 20% for tenants with over 10,000 issues could go unnoticed in standard tests but cripple productivity for affected teams; their system flags it within hours.
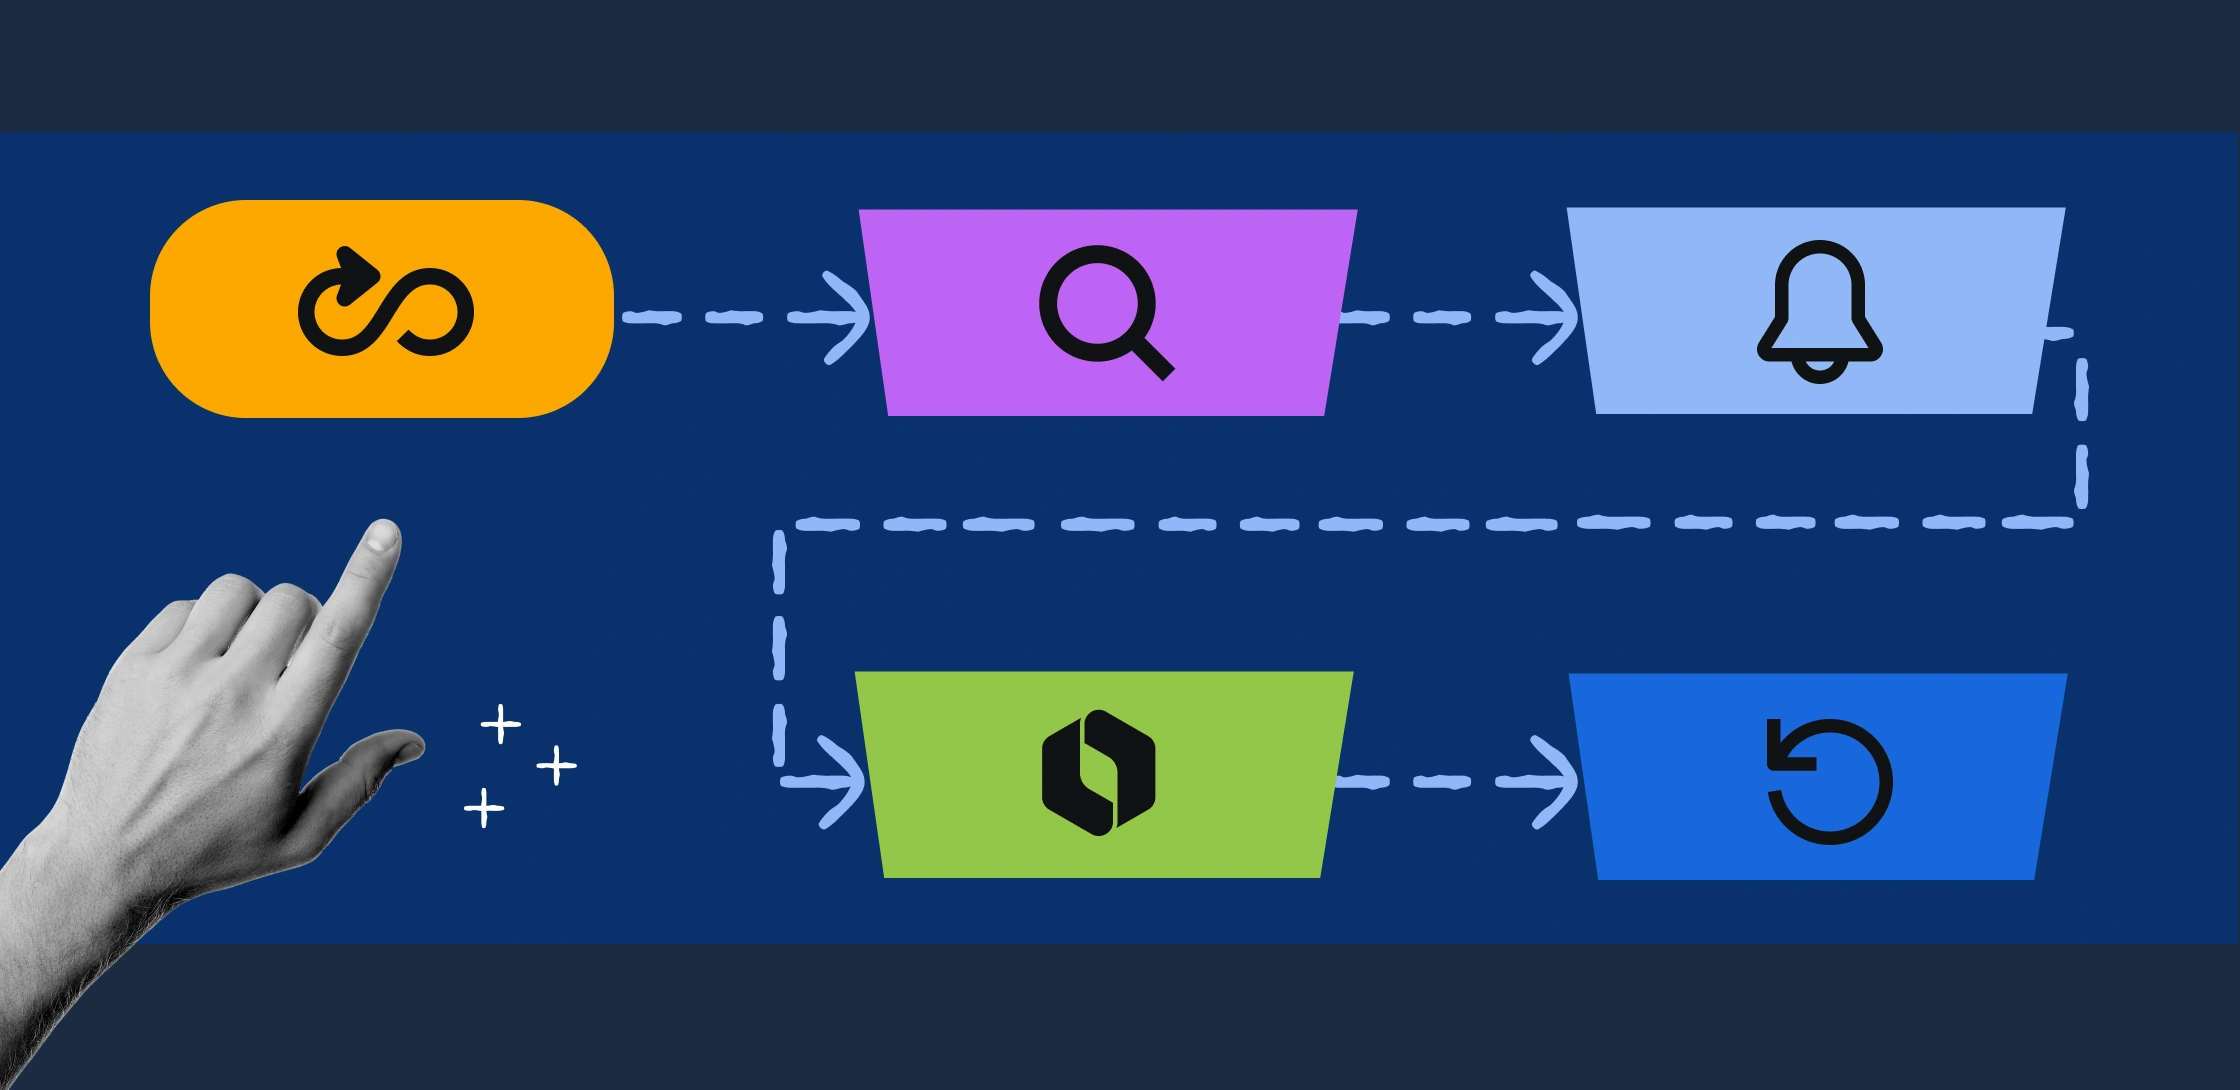
Telemetry Collection: The Foundation of Regression Detection
At the heart of Atlassian's strategy lies comprehensive telemetry collection from every Jira Cloud tenant. They instrument key code paths with custom metrics, capturing latency distributions, error rates, and resource utilization at granular levelsdown to individual API endpoints and database queries. This data streams into a centralized observability platform, where percentile-based monitoring (p50, p95, p99.9) reveals outliers that average metrics might mask.
For teams building scalable cloud services, this means shifting from reactive alerting to predictive insights. Consider a scenario where a new indexing algorithm boosts average search speed by 15% but degrades p99 latency for tenants with rare custom fields; telemetry pinpoints this by correlating slowdowns with tenant metadata like issue volume or plugin count, enabling targeted rollbacks before user complaints surface.
Automated Anomaly Detection with Statistical Guardrails
Raw telemetry alone isn't enough; Atlassian employs machine learning-driven anomaly detection to sift through petabytes of data. Models trained on historical baselines flag deviations using techniques like exponential smoothing and Bayesian change-point detection, tuned to ignore benign fluctuations from traffic spikes while alerting on true regressions.
This system's power shines in edge cases: a minor code tweak in permission checks might add 50ms to loads for 0.1% of tenants using legacy integrations. Engineers receive Slack notifications with drill-down dashboards, including flame graphs and tenant-specific traces, allowing root-cause analysis in minutes. In one real-world example, this caught a memory leak in a GraphQL resolver affecting high-customization tenants, mitigated via canary deployment halts.
Canary Deployments and Progressive Rollouts
To mitigate regressions without halting innovation, Atlassian uses sophisticated canary deployments, routing 1% of traffic to new versions initially. Performance is monitored in real-time via synthetic probes and real-user monitoring (RUM), with automated circuit breakers pausing rollouts if regressions exceed thresholds like 5% p95 increase.
Progressive rollouts segment by tenant cohortssize, region, feature flagsensuring regressions stay contained. For project leads deploying microservices, this mirrors Kubernetes-style traffic shifting but at SaaS scale, preventing incidents like the 2023 outage from partial deploys. A table summarizes their deployment safeguards:
| Stage | Traffic % | Detection Method | Mitigation Action |
|---|---|---|---|
| Canary | 1% | ML Anomaly + Synthetics | Auto-Pause & Rollback |
| Expand | 10% | Percentile Alerts | Cohort-Specific Halt |
| Full | 100% | Global RUM | Shadow Mode Validation |
Post-Mortem Analysis and Continuous Improvement
Every flagged regression triggers a blameless post-mortem, feeding a regression knowledge base with patterns like 'query optimizer backslides' or 'cache invalidation races.' This evolves detection models, reducing false positives by 40% quarterly. SREs benefit by adopting similar loops, turning incidents into systemic defenses.
Frequently Asked Questions
How does Atlassian differentiate tenant-specific regressions? By segmenting telemetry with metadata like issue count and custom fields, ensuring slice-level precision.
What tools power their anomaly detection? Custom ML models using Bayesian methods on Prometheus metrics and Jaeger traces.
Can these techniques apply to non-SaaS projects? Yes, adapt for CI/CD pipelines with tools like Grafana and Argo Rollouts.
My Take
Atlassian's approach sets a gold standard for SaaS reliability, blending telemetry depth with automation to tame scale's chaos. I recommend SRE teams implement similar percentile monitoring and canary gates immediatelyit's not just defensive, but a launchpad for fearless velocity in 2026's AI-driven dev world.