Fixing Power BI date spillage is a critical step for developers dealing with time intelligence DAX calculations that stretch into future dates. When working with Month-to-Date (MTD) or Year-to-Date (YTD) measures, Power BI naturally evaluates every date on the axis, often resulting in flat lines and misleading trends for users. This guide breaks down four distinct DAX-based approaches to prevent measures from spilling into empty future dates.
This tutorial is designed for Power BI developers and data analysts who need to maintain clean, accurate reporting dashboards. By implementing these DAX solutions, analysts can ensure their charts only reflect actual available data, preventing user confusion and maintaining the integrity of forecast-enabled tables.
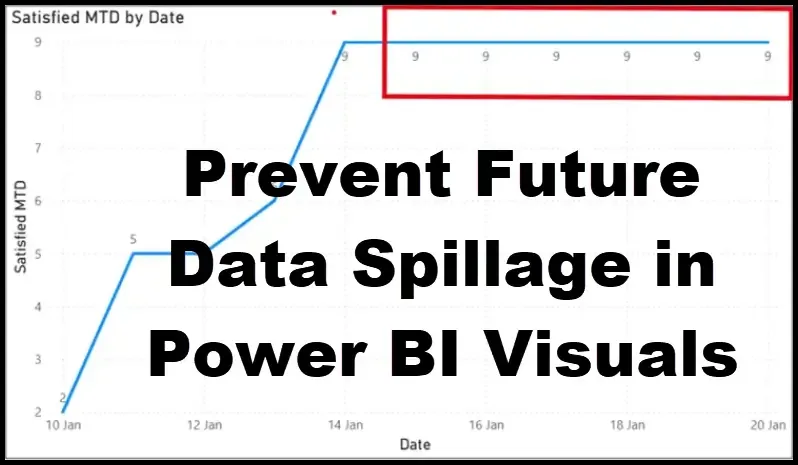
Understanding the Spillage Problem
The issue typically arises when a data table, such as the Sample_Survey_Data table, only contains records up to a specific date like January 14, 2026, but the connected Dates Table extends further into the future. Without explicit logic, a base measure calculating the count of satisfied responses will continue plotting flat lines across those future dates. To demonstrate the solutions, we first need to establish the base measures that trigger this behavior.
Satisfied Count =
CALCULATE(
    COUNTROWS(Sample_Survey_Data),
    Sample_Survey_Data[Satisfaction] = "Satisfied"
)
Once the base count is established, developers typically wrap it in a time intelligence function to calculate the Month-to-Date performance.
Satisfied MTD =
CALCULATE(
    [Satisfied Count],
    DATESMTD(Dates_Table[Date])
)
When plotted on a line chart, the Satisfied MTD measure will continue to draw a flat line after January 14, which is highly misleading to reporting users. Here are four ways to manage this issue effectively.
Approach 1: Using ISINSCOPE and MAX
This method is highly efficient because it ensures the logic only applies when the date is actively on the visual's axis. It successfully identifies future dates and stops Power BI from plotting them while keeping totals intact and remaining safe for drill-downs.
Using ISINSCOPE =
IF(
    ISINSCOPE(Dates_Table[Date]) && MAX(Dates_Table[Date]) > MAX(Sample_Survey_Data[ResponseDate]),
    BLANK(),
    [Satisfied MTD]
)
Approach 2: Using MAX Date Only
A simpler but less flexible alternative involves strictly comparing the maximum dates. Developers must use caution with this method, as it can suppress totals and behave unpredictably in matrices or multi-date contexts. It is best reserved for quick prototypes where totals are unnecessary.
Using MAX Date Only =
IF(
    MAX(Dates_Table[Date]) > MAX(Sample_Survey_Data[ResponseDate]),
    BLANK(),
    [Satisfied MTD]
)
Approach 3: Explicit CALCULATE Filters
Instead of using the DAX ISINSCOPE function, developers can explicitly filter dates inside the CALCULATE function. While straightforward, this explicit nature means it might conflict with time intelligence logic or override existing slicers on the dashboard.
Using Explicitly Filtered Dates =
CALCULATE(
    [Satisfied MTD],
    Dates_Table[Date]
Approach 4: Maximum Available Data Date
Considered an enterprise-standard solution, this approach anchors the measure to the most recent date containing actual data. It effectively ignores empty future dates, aligns visuals perfectly with available records, and gracefully handles late-arriving data.
Using Max Available Data Date =
VAR _LastDataDate =
    CALCULATE(
        MAX(Sample_Survey_Data[ResponseDate]),
        ALL('Dates_Table')
    )
RETURN
IF(
    MAX('Dates_Table'[Date]) > _LastDataDate,
    BLANK(),
    [Satisfied MTD]
)
My Take
Relying on visual-level filtering, such as setting the Dates column to be less than or equal to today, is a fragile workaround that breaks consistency and fails to protect measures across the broader report. A robust DAX-based approach is non-negotiable for enterprise-grade Power BI development. Visual filters are easy to forget and do not scale well across complex semantic models.
Among the methods discussed, Approach 4, which anchors to the maximum available data date, stands out as the most resilient strategy for production environments. By dynamically calculating the last data date using the DAX MAX function, developers future-proof their dashboards against delayed data refreshes and irregular reporting schedules.
Ultimately, mastering these DAX context modifiers separates basic dashboarding from professional data modeling. As organizations increasingly rely on automated time intelligence, implementing strict boundary logic ensures that executives are looking at accurate trends rather than confusing, flat-lined projections.