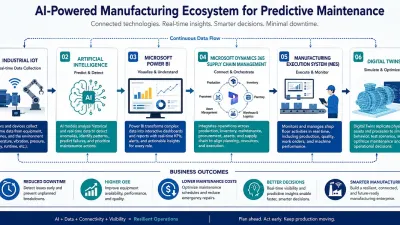

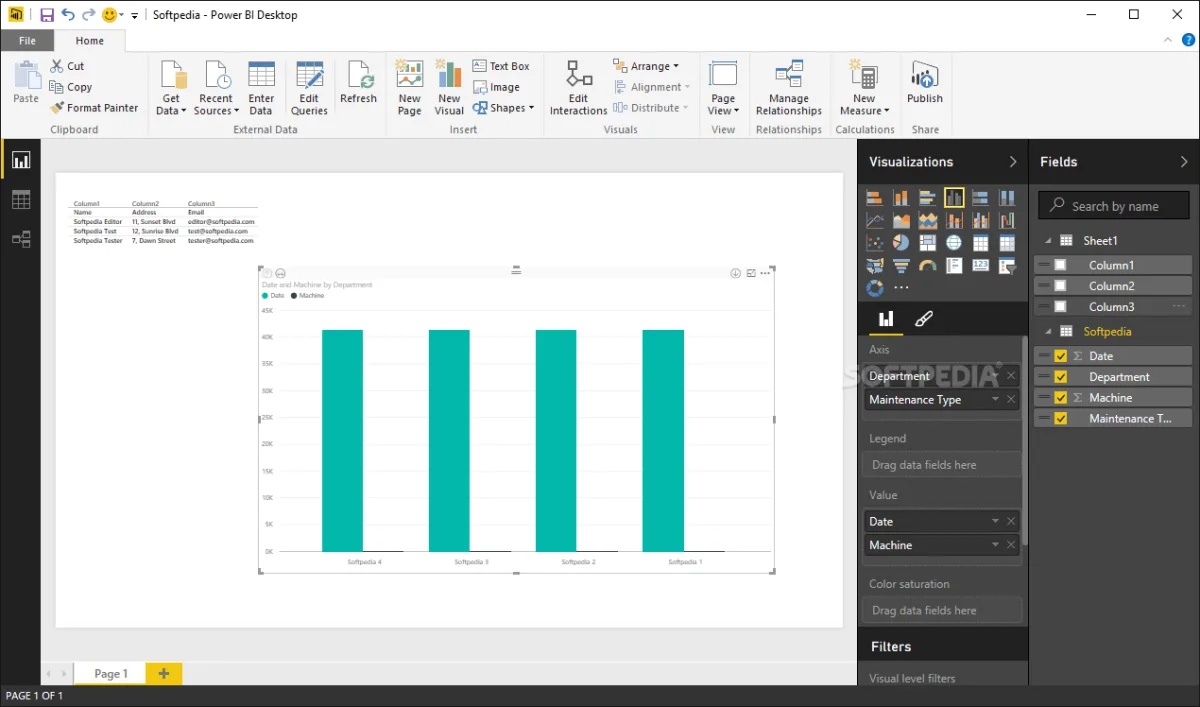
Transforming raw data into actionable business insights is the core focus of the newly updated Microsoft Power BI Desktop (version 2.157.879.0). Designed as a standalone companion to Microsoft's broader cloud service, this powerful analytics tool allows users to query, organize, and visualize complex datasets without requiring an active enterprise login just to build reports. By offering a familiar interface that mirrors the classic Office suite, it bridges the gap between basic spreadsheet management and enterprise-grade business intelligence.
The software provides a generous multi-page workspace where elements can be arranged using intuitive drag-and-drop actions. Users can configure relationships between different fields, treating datasets similarly to relational database tables. This structural approach ensures that even the most complex data models remain organized and accessible for deep analytical querying.
Extensive Data Integration and Visualization
One of the strongest advantages of Microsoft Power BI Desktop is its sheer versatility in data ingestion. The platform supports an exhaustive list of sources, ensuring compatibility with almost any existing corporate infrastructure. Supported data sources include:
- Standard files like Excel workbooks, CSV, XML, and text documents.
- Major databases including SQL Server, Access, Oracle, IBM DB2, MySQL, PostgreSQL, and Sybase.
- Enterprise and cloud services such as Microsoft Azure, SharePoint, Active Directory, and Microsoft Exchange.
- Third-party platforms like Hadoop, Google Analytics, Salesforce, and GitHub.
Once the data is imported, users can generate compelling visual representations that go far beyond raw tables. The application includes an assortment of built-in graph and chart types, such as interactive maps, cards, and gauges. Furthermore, users have one-click access to customize chart elements, including axis data, legends, colors, values, filters, reference lines, and labels. If the default options are insufficient, the platform allows the importation of custom visualizations to meet specific reporting needs.
The Strategic Trade-off of Ecosystem Lock-in
While Microsoft Power BI Desktop is an incredibly robust and free tool for local data modeling, its export limitations reveal a clear ecosystem strategy. The software allows users to build comprehensive reports offline without signing into a business account, but sharing those insights requires publishing them directly to the Power BI platform or exporting them to a Pyramid Server. Crucially, reports cannot be saved in any other standard format.
This restriction acts as a strategic funnel for Microsoft. By providing enterprise-grade visualization and data querying tools for free on the desktop, they eliminate the barrier to entry for data analysts. However, once a business relies on these rich, interactive reports, they are effectively locked into the Power BI ecosystem for distribution and collaboration. For organizations evaluating their business intelligence stack, this means the initial cost savings of the desktop app must be weighed against the long-term commitment to Microsoft's proprietary sharing infrastructure.